
DATA VIZ


Our AI Hopes & Fears
Hidden Data is a visual exploration of how people feel about A.I.— its presence in everyday life, its emotional weight, and its environmental cost.
As A.I. quietly integrates into the background of our routines, decisions, and even creativity, this project brings its hidden impact into focus.
Using responses gathered through conversations and surveys, we designed an interactive data visualization with P5.js—illustrated and playful, yet grounded in real feedback and statements.

The full presentation
Scroll down for the short version


DESIGN BRIEF
"Design an interactive data visualisation using P5.JS that brings to life hidden data."
As Artificial Intelligence becomes a larger and larger part of our daily lives and of our media coverage, we wanted to learn how people were really feeling about their relationship with A.l.
Ireland is uniquely positioned as a country with a complex relationship with Data Centres and the tech companies engaged in the Aul arms race.
We wanted to discover how many people were using A.I, how often, their hopes and fears around it and how aware they were of their environmental impact.


RESEARCH
We knew we would be using A.l quite a bit for coding and data processing so we wanted to tackle the hidden data behind the impacts of A.l and people's relationships with it.
We started with an exploratory survey to gauge how people were feeling. We went out on the street and digitally to try and cast as wide a net as possible.
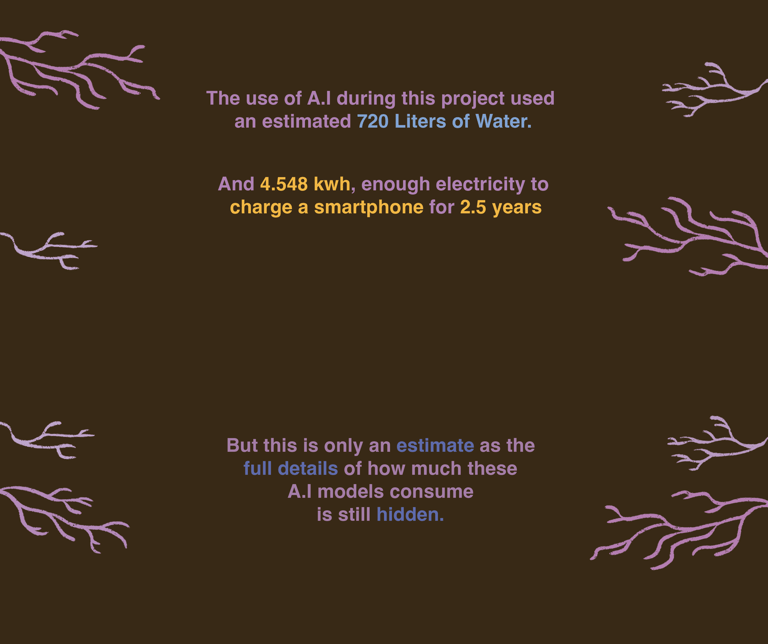
We took this rich qualatative data, digitised it in spread sheets and used A.l to help us analyse sentiments and trends to convert this in to quantatative data for our visualisation.
Alongside this we dove in to papers and articles about the A.l industry and started to develop our story.


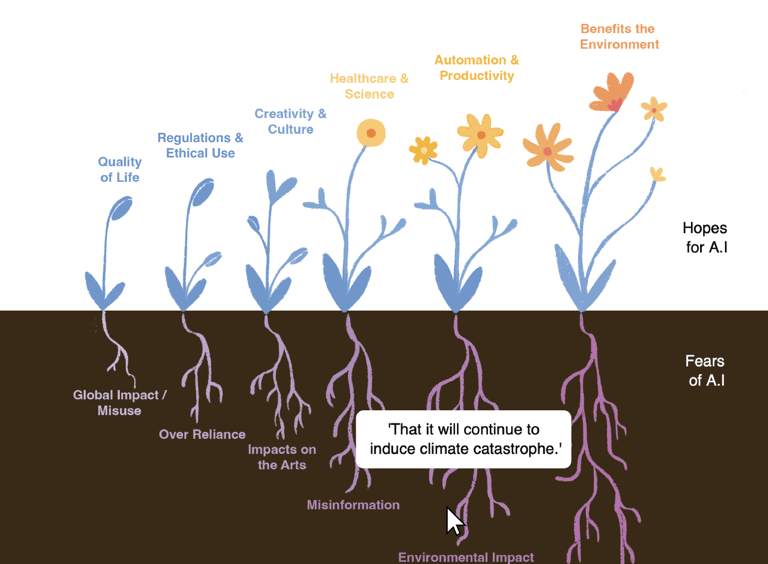
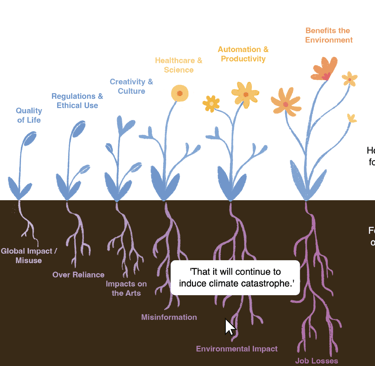
The data Viz
In P5.js
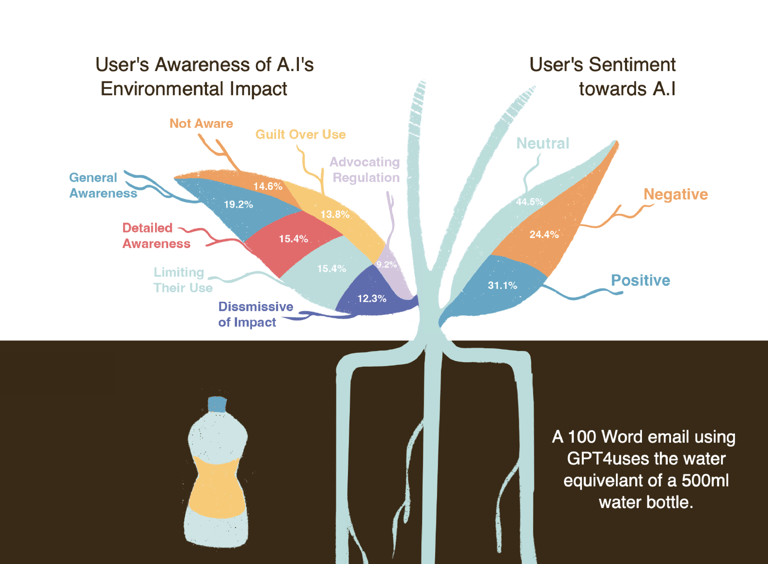
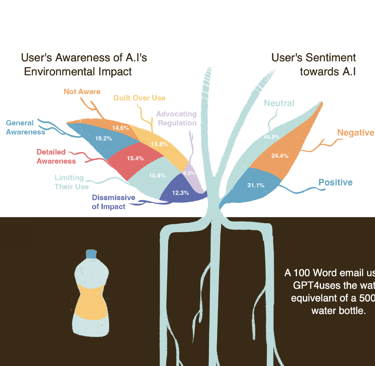


SCREENSHOTS
THE DATAVIZ


Thank you for watching :)
DataViz realised by Arianna Di Donato
In collaboration with Jack Flynn
NCAD, 2024
Let's create something together! :)
Have a project in mind or a question? Reach out via the button below, email me directly, or connect with me on social media.
💌 Hello@flipsieflopsie.com
© 2025. All rights reserved.